How accurate is the weather forecast?

Weather forecasts are one of these things we rely on daily and rarely actually think about. This blog post will disects how they work (at least in Germany). I was curious to see if the forecasts are acurate, and we’ll get to that as well.
Ask the weather frog
When you open the default weather app on iPhone it will use the forecasts by the DWD (Deutsche Wetterdienst) = German metrological association. The DWD runs a huge real-time weather simulation which takes into account hundreds of parameters like:
- precipitation
- rain
- temperate
- dew point
- atmospheric pressure
etc etc. Metereological models are physical models, and we can see this reflected in the model developed by the DWD, called MOSMIX. Their model contains a dozen or so parameters describing the physical weather.
Ok, so, we observe physical measurements from ground stations, and model the weather based on them?
Well. Yes and no. That’s how the theory goes. In practice the MOSMIX model does a few more things:
- breaks up the world into a workable geometry (polygons)
- multiple “global” weather levels are observed from satellites, soil and ocean stations
- the base simulation is supplemented using ground station data for every polygon
Using all those steps MOSMIX produces up to 10 days of weather forecasts.
How do we get from the weather model to weather forecast?
When your iPhone app grabs the weather from DWD, it determines which polygon your location is in. It then uses the polygon ID to obtain a forecast for your area. This is what you see when you open the app. An area average.
Is it accurate?
Well, this wouldn’t be a data engineering blog if we didn’t run some experiments. In order to do so, I ran the following pipeline:
- define a list of 10 weather stations in a diverse set of points (big and small cities) to sample from
- define a set of parameters to measure (precipitation and temperature)
- retrieve the forecast data 240 hours (10 days) into the future for every weather station
- store every sample in a database (I opted for Google BigQuery)
Using the data procuded in this pipeline one can then create a model to compare the forecasts with ground truth data.
The sample data
Using this pipeline, I recorded the forecasts for parameters precipitation and temperature for 6 months from 10 forecast destinations, equivalent of 4417 hours of weather forecast data. This sample was then mapped to ground truth stations which overlap the same polygon. In this process I found out, not all observation projections actually map to existent weather stations. Cleaning up, this left 7 stations. Using these 7 weather stations, only observation hours with a complete 240 hour forecast record were retained. This step removed 135 out of 4417 hours (~3%).
Using this process 1680 measurements per station and parameter were obtained.
Modelling the data
I simplified the data by averaging across stations and then averaging the forecasts for every hour, which yields a ratio of \(240:1\) for every parameter and observation. This data was then used as the basis for a linear regression.
Regression analysis
The regression yields a correlation of 0.97 for temperature (+- 0.0036) and 0.43 for precipitation (+-0.0423). Using a logistic regression classifier and 10-fold cross-validation, an average accuracy of 89% was obtained for temperature, whereas precipitation yielded an average accuracy of 15%. Using regularisation did not affect the results.
Visual inspection of the model
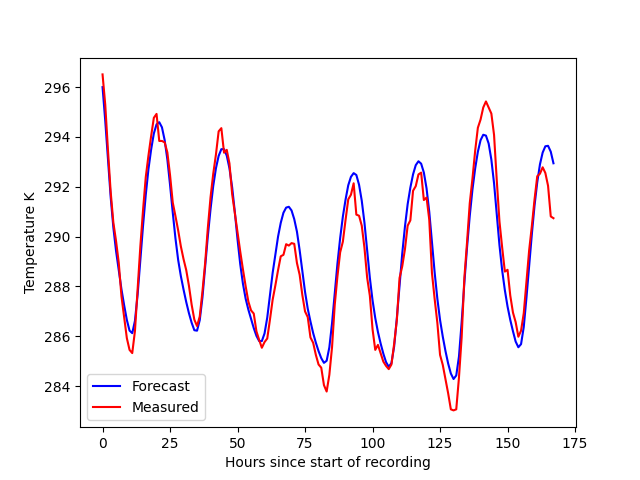
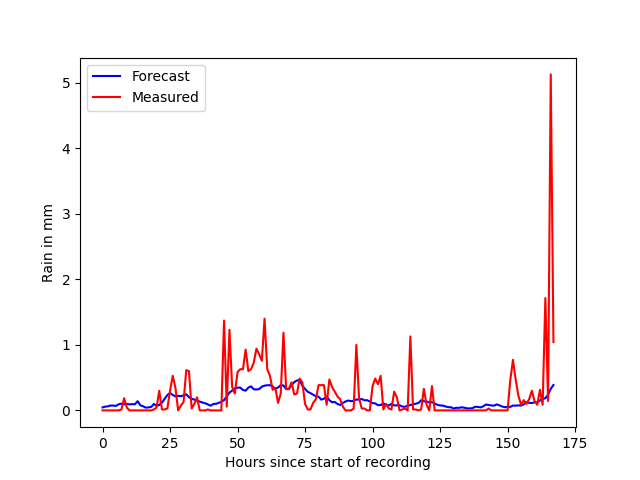
The temperature forecast can be seen to follow a sinusoid function with the forecast closely aligning with the ground truth. Precipitation is a sporadic event which is inadequately modelled.
Result
From this analysis one would conclude that the weather forecasts generally holds true for temperature. If your weather app says you need a sweater, you’d best get one. The same cannot be said (at all) for rain. With an average accuracy of 15% you may as well flip a coin.
Discussion
This analysis has some major drawbacks, namely:
- averaging data skews results to some extent!
- it doesn’t have enough stations to make a definite ruling
- it doesn’t run long enough to make a definite ruling
However, even with the limited data, we can clearly see precipitation modelling is not adequate. This could be for many reasons. I suspect, microclimatic phenomena are badly modelled by using polygons. The forecast quality suffers at the edges of the polygons, and it shows. So unless the model is closely aligned with the projected ground truth weather station, you are unlikely to get a good forecast for rain. This is what spiked my personal curiosity, because its also what the weather forecast feels like. Somewhat accurate, but rain is amiss.
Acknowledgements
Marc Baumholz and me worked together on this fun project for some time and it could not have happened without him! Many thanks! If you are interested in reproducing this experiment, the source and accompanying technical report are on GitHub!